Switch on Learning (description)

At the Windsor-Essex Catholic District School Board, we are Switching on Learning by integrating Google’s powerful ecosystem into every classroom. This blog is a dedicated space for sharing the ideas, methodologies, and digital tools that transform the modern educational experience. Our Digital Toolkit We empower educators and students by leveraging a robust, collaborative environment: Google Workspace for Education: Driving seamless collaboration through Docs, Drive, and Classroom. The Power of AI: Utilizing Gemini and integrated AI features to personalize learning and spark creativity. Data-Driven Assessment: Using MarkBook to track student growth with precision and transparency. The Process of Learning: Leveraging Revision History to emphasize growth, iteration, and the visible journey of a student's work. From interactive Chrome tools to digital storytelling, we aren't just using tech—we’re using it to bridge gaps, foster global collaboration, and future-proof our students' skills.

The Ultimate Guide to Creating Assessments with Google Forms

The Ultimate Guide to Creating Assessments with Google Forms


Google Forms is an easy but powerful tool for teachers to create online assessments for their students. And with the help of the Flubaroo add-on, the quizzes can be graded automatically as well. There are many benefits for using online assessments with students:
  • Quicker feedback - With autograding quizzes, students can get their results in a matter of minutes, rather than having to wait until the next day (at the soonest) to see if they understand the material or need more help.
  • More frequent assessments - Since the quizzes can be graded electronically, teachers can easily give small assessments each day or so, giving teachers much more frequent feedback on how their students are doing, and if they need to adjust their instruction.
  • Statistics - Since the assessments are digital, so are the results, which makes it much easier to do item analysis, look for patterns, and determine where the needs are.
  • Collaboration - With digital assessments it is easy for teacher to collaborate with their colleagues when writing the quizzes, or to share assessments with other staff for their use.
  • Special Needs - By going digital we are also able to take advantage of assistive technology. For example, with online assessments students can zoom in as needed, and use text to speech to read the questions.
  • Multimedia - Online assessments don’t just have to be digital versions of the same old paper and pencil tests. Instead we can incorporate colour images and videos to provide a richer experience.
  • Savings - And of course going paperless can help save on paper, ink, and budgets.
And there are probably many more benefits as well. The next question then is … 
how do you create, distribute, and grade online assessments?

See below for a large collections of resources I have created to give you everything 
you need from getting started to advanced techniques. You will find two videos
each an hour long, as well as several help guides and slideshows.

 Help Guide - "Using Google Forms for Online Assessments" - Google Document link


Article Written by: Eric Curts Small adaptations were made to the article for the purpose of this blog.  Click HERE to visit Eric's website and view the full article. 

Eric Curts is an Authorized Google Education Trainer and a Google Certified Innovator.  His website Control Alt Achieve features extensive resources that he has created over the years focusing on transforming education with technology.  


I Heart Desmos

I have written about Desmos before but that was two years ago. And the folks at Desmos have been busy. Specifically today I want to talk about three specific things they have given us since.

Activities by Desmos

One of the first things they started to create was a set of activities that, at times, didn't even use the graphing calculator. But all of them are really well done. I still think my favourite is Central Park. In this one students walk through the development of what a formula is. And they do it in such a low key way that starts with estimation and a simple visual interface that deals with making parking spaces. Other activities like Penny Circle (modelling functions) used the skills of Dan Meyer to interface the graphing calculator with an interesting activity. Function Carnival (distance time graphs), Tile Pile (ratios) and Waterline (modelling functions) showed the diversity of mathematics. From lower end ratio stuff all the way to related rates.
And then they came out with Polygraph. This was basically the game Guess Who. That is, you pick a graph and then your partner has to ask yes/no questions to help guess what graph you chose. The neat part is that each student does this from their own computer or device and they play against each other with Desmos randomly pairing them up. You set up the class as the teacher and give the student the four character code and end up with a record of what each student did during the activity. With Polygraph they have made several versions: Parabolas, lines, basic quadrilaterals, advanced quadrilaterals, hexagons, and rational functions.
Regardless of the activity, you create an account on teacher.desmos.com and then start the activity. You will be given a unique four character code for your students to enter when they go do student.desmos.com.

Polygraphs

Once Polygraphs came out, the online math community loved it so much that they asked for the ability to create their own. So it wasn't long before Desmos released Custom Polygraphs. They are pretty easy to make. Here is one that I made about distance time graphs.
Making them is pretty easy and basically just requires you to create each graph in Desmos. One piece of advice about making these is that you should plan out the 16 different choices ahead of time, but try not to have too much diversity or it may be too hard for students to solve the puzzle. Another neat idea is that you actually don't need to have the choices as graphs. Because you are using the Desmos calculator, you can actually just import an image in for each choice and not have a graph there at all. Like this one for primary students that has nothing at all to do with math.

Desmos Activity Builder

Once teachers started really using Desmos, they started coming up with complete activities that used Desmos as their backbone. Something like this activity jointly created by Cathy Yenca and Michael Fenton called Match my Graph. Desmos saw what they were doing and thus create the Activity builder. This now gives teachers a way to essentially create an interactive slideshow that has Desmos as the backbone. Once you have an idea, its pretty easy to put it together. Here is one that I put together on Anscombe's Quartet.
When you make these you have three choices of slides. A graph, a question or text. The question slide is very interesting as you ask a question of the students and they type in their answer and then you have the option of letting them see how other people answered. It's a neat feature to let students know how others have answered the same question.

The Desmos Community

With all of these tools now available for teachers to use and create with that means there are a large number available for us to use. You don't have to create something that someone else has already done. To that end there are currently two ways to search for these teacher made activities. Desmos has built it right into teacher.desmos.com by including a search feature on the top right. Enter a topic or teacher name and the available activities pop up. The other place is a teacher created community called the Desmos Activity Bank. Here teachers can submit their Desmos activities and anyone can use them. One of the nice things about all of these activities is when you get to them just click on Start New Session and it automatically gets added to your Desmos teacher account.

So make use of all these tools to help make the learning in your math class dynamic and Desmosified

10 Creative Alternatives to Research Reports and Papers

Research reports and papers have been around a long time. They haven't evolved much. Here are 10 ways to make them more relevant. (Flickr / Nic McPhee)

10 creative alternatives to research reports and papers


 The following article was pulled from the Ditch the Textbook website 
by Matt Miller

I felt the 10 alternatives are worth a look and so is his website.

Doug

The merits of doing research and creating these reports and papers are valid. When they create them, students …
  • Gather information
  • Evaluate sources
  • Organize and synthesize data
  • Form ideas and cohesive thoughts
  • Create a polished, finished product
  • Cite where they got their information
Here’s the problem, though: the finished product just isn’t very relevant to the real world, be it in the workforce or in people’s personal lives.
Reports and papers often end up where mine always did — in the trash.
If students are going to do their best work to learn and create, shouldn’t it be in a form they can be proud of — and that they want to show others?
I think it’s time that we turn research reports and papers on their heads. Here are 10 creative alternatives:
1. Websites. By making a free website using tools like Weebly and Google Sites, students are much more likely to attract eyeballs to their work. Websites can be shared easily, and they live on when people stumble upon them through Google searches. When students publish their work to a website, they’re creating a positive digital footprint as well.
2. Piktochart infographics. Have you seen those super long infographics that you have to scroll down through to see all the information? They’re all overPinterest and other social media. Piktochart can turn a report or paper into a flashy eye-catching visual. Start with a predesigned template or use the graphics, text and other goodies to create your own from scratch. (Here’s a post I wrote with 20 ways to create classroom pizzazz in class with Piktochart.)
3. Google Drawings interactive posters. Gathering lots of information for a report or paper onto a poster board might be impossible (or require teeny tiny text!). A Google Drawings interactive poster (see post on this here) fits the in-depth research genre better because it can be a jumping off point for more information. Use a Google Drawing to present some visuals. Then, create links from that poster to Google Docs or other resources that provide more information about the topic. Be sure to use a live hyperlink (Ctrl+K is the keyboard shortcut) to get readers where they want to go.
4. Linked YouTube videos. Researchers gather information and present it in video format in front of an audience of millions every day. It’s called television news. Students can create short videos on the different segments of their report or paper. Then, they can upload them to YouTube and link them together usingannotations. It becomes an interactive video version of their reports. See this example I did with a post I wrote on Google Classroom.
5. ThingLinks. ThingLink lets students create clickable hotspots on an image. Students use an image (either use a pre-existing one, an information-based one like a map or a chart, or create one with a tool like Google Drawings orPicMonkey). Then, they add clickable dots to important parts of that image. Those clickable dots can take readers to sources already existing on the Web or to Google Docs or other sources created by students. See ThingLink’s website for examples of how this awesome tool works.
6. Radio shows. Programs like “This American Life” and other audio documentaries do a phenomenal job of creating long-form stories and journalistic presentations in an engaging way. With some planning, students could record a compelling podcast/radio show presentation about their content. They could add interviews, sound effects, background audio from a site like a restaurant or a bus station, etc. Use tools like Audioboom (upload audio so others can listen to it) and Audacity Garage Band (for mixing audio). Can be simple or complex.
7. News broadcast. In No. 4 above, we used short video clips to create an interactive video presentation. But news broadcasts generally aren’t very interactive. Students could create a news show, blending video, images, sound and effects together using a tool like WeVideo or Camtasia Studio. It could be uploaded to a class YouTube channel where others could watch.
8. Info/image slide show. The “Did You Know?/Shift Happens” videos created by Karl Fisch and Scott McLeod have been viewed millions of times on YouTube. They’ve taught us about rapid changes happening globally, and we willingly watched because they were engaging. These text-based slideshow videos can be very popular, and students can create them with YouTube’s photo slideshow tool or Animoto (free for educators).
9. Aurasma aura poster. This one actually utilizes poster board, but it’s so much more than the standard poster. With Aurasma (an iPad app), students can create auras. An aura is a video or image that displays over something in real life when you look at it through the camera in the Aurasma app. (Here’s an example of how it works.) Students can create auras for different images on their posters. When the viewer scans the images with the Aurasma app, it displays videos or images with more information.
10. Google Slides slide book. I’m all for ditching textbooks, and this is a great way to do that. Instead of using a standard textbook, students can show their understanding by creating an interactive, engaging one! In place of reports and papers, students could create a slide book like this one (created by Matt Macfarlane, a teacher who provides this to his students). Notice the images, links to sites and embedded videos.


Guest Post: EDpuzzle- Import Videos and Incorporate Questions


EDpuzzle is a free tool that allows you to import videos from sources such as Youtube, Ted Talks, etc and then edit the videos and incorporate questions for the students to complete into the videos.  The program then tallies the performance of your students and displays the results.


Personally I have used it for:
  • Review of material
  • Flipped Classroom
  • Completing simple material that I do not want to spend class time on.


The students I have used it with have found it very easy to use and seem to enjoy interacting with the videos.  Furthermore, once an EDpuzzle is created it is available for anyone to use, so you can search EDpuzzle itself for videos related to your topic of interest.


Instructions for Setting up an EDpuzzle


Step 1 - Create a teacher account
Simple follow the onscreen instructions.  I would recommend using your Mytools2go account as your log in.


Step 2 - Create a Class


Once you are logged in as a teacher you will see a screen like the one above and you will select ‘Add Class’ from the left bar.  This will create your class and provide you with a class code as seen in the middle of the screen above.  This code you would tell to your students and when they sign in as a student they simple join your class by inputting this code and anything that you assign will be visible to them.


Step 3 - Create a video


Select ‘My Content’ then click on Create → New Video
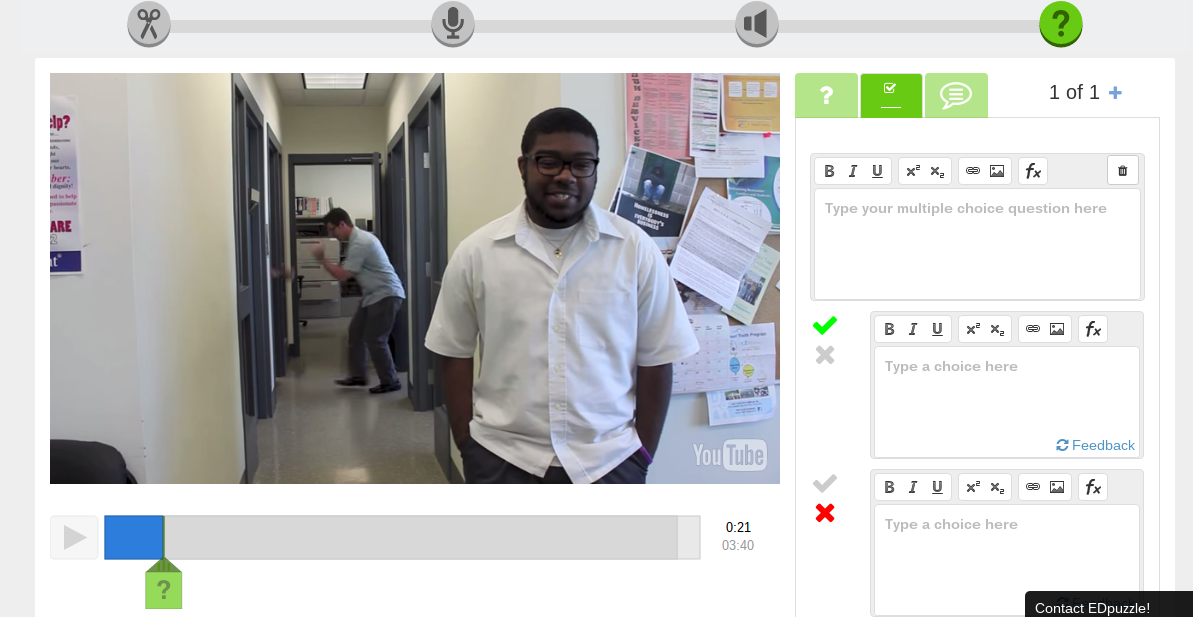
You will then copy and paste the link to the video you have chosen to have the students watch in the search tab and press enter this will then take you to a new screen that will allow you to begin editing and adding questions to the video.


You then press play and have the video begin.


Once you reach a point in the video in which you want to have the students engage by asking them a question or polling what they think before the answer is given you pause the video and select the question mark icon along the top.


This will then cause a question mark to appear along the video progress bar.  You will press this question mark and then select the type of question you wish to ask either an open response or a multiple choice.


You type your question and the possible solutions and click save.  You can repeat this for as many questions as you wish to ask.

Once you have finished adding question you simply hit save at the top and then finish.  It will then prompt you assign the video to your class.


Adam Mills
Mathematics and Physics Teacher
Assumption College Catholic High School


Caution on new Iphone iOS 9 Feature

The new iOS 9 has a new feature that will allow your iphone to switch between your data plan and wifi to keep a strong uninterrupted signal.  This feature is on by default.  Keep an eye on this!  It can be very useful but some social media apps and other websites can pull some major bandwidth quickly!  This is OK on wifi but if your iphone switches automatically between the two you may get a very high unwelcomed data bill!

Please look for a more detailed report here:  

That's how they do that...!

CREATING VIDEO INSTRUCTIONS AND NARRATED PRESENTATIONS USING SCREENCASTING SOFTWARE

WHAT IS SCREENCASTING? 

Wikipedia defines a screencast as a digital recording of a computer screen output, also known as a video screen capture, often containing audio narration. 

A screencast is essentially a movie of the changes over time that a user sees on a computer screen, enhanced with audio narration.

There are two free options for creating screenscasts quickly.

LEARNING OPPORTUNITIES

In the classroom, screencasting is an opportunity for both educators and students:

  • NARRATED PRESENTATIONS
    • Students and Teachers create a slideshow or image, create a screencast while narrating the slideshow, and then 'present' the video to the class, or simply share it on YouTube
  • STORYTELLING
    • Tell a story by creating a document and reading it while taking a screencast and then posting the video
  • VIDEO INSTRUCTIONS
    • Teachers and students can prepare step-by-step instructions on how to do almost any computer process by recording their screen as they do it


The Future of Field Trips

So I just purchased my own Google Cardboard. And if you don't know what that is, well then this post is for you. Depending on your age you might remember a thing called a ViewMaster. You may have even had one as a kid. Well Google Cardboard is the 2015 version. Google Cardboard is the way to get an Oculus Rift-like 3D virtual reality experience for a fraction of the cost. It is basically a cardboard holder for your smartphone and takes stereographic images to the next level. So before I go any further, let me show you a very quick demo of what Google Cardboard can do (at least a few features):

So you get the 3D effect (like on a Viewmaster) because you are seeing two stereographic images (one with each eye) and because these images and videos are shot with a special 360o camera rig, that means you can take advantage of the gyroscopic tech in your phones to actually look anywhere in those images or videos (even as the video is playing).

Google Cardboard Not Needed

Now you don't actually need Google Cardboard to be able to take advantage of this technology. You can view these VR images and videos right on your computer. So for example, take a look at the Mythbuster's Shark video that I was viewing in my above demo. If you look on the top left you will see this circle that you can click on while the video is playing. And when you click on it you explore around the video.
You can also do this on your iPhone or Android phone. But it works way better because you can just move your phone around and it will move around the image based on the orientation of your phone. It works seamlessly within the YouTube app on an Android phone but on the iPhone you need the In360Tube app for it to work.

Google Cardboard Field Trips

Now there are many apps (iOS, Android) that try to take advantage of the 3D VR environment. There are games, videos and animations and a lot of this stuff is just kind of neat but so far there seems to be a lot of mediocre stuff as this technology just starts to be used. But what I foresee in the future is that this could be used to have virtual field trips where kids can be immersed in the location. Like the video below, we could send kids to far off places to explore the surroundings in a more interactive way (check out this one about the astroids around us). Right now there isn't too much but I feel like there will be a lot to see in the very near future. And once the content is there then I can imaging students in geography classes exploring natural formations or travel & tourism classes exploring far off cities or art classes exploring foreign museums. The possibilities are many.

Where do I get Google Cardboard?

When you go to the Google Cardboard page you will see a section where you can Get Cardboard. Now Google doesn't actually make the viewer (as far as I know) but there are several companies that do and they range in price and style. I bought mine on Amazon for pretty cheap. And despite the simplicity of these things (they are made of cardboard, right). You can get some that have nice options. Some even have slots so you can install head straps so you don't have to hold it. Some are more stylish than others. But regardless, you want to make sure that you get one that has NFC (near field communication) so that it has the "clicking" function for more ease of use. But regardless of which one you get you will likely get a flat piece of cardboard in the mail that you have to put together (origami style) to create your viewer.

Update (Oct 1, 2015)

It seems that Google is actively looking into using Google Cardboard for field trips as it seems they have some pilot programs already in place. See this article from the NY Times.


Update (Feb 15, 2016)

  • As mentioned Google was coming out with a virtual field trip program. Called Expeditions, these use Google Cardboard to take virtual field trips. Sign up and get info here.
  • Nearpod has started to produce content to exploit the Google Cardboard technology with Nearpod VR. Check it out here.
  • And there continues to be more and more videos out that use the VR technology, like this one on the solar system:

Update (Mar 6th, 2016)
Though this is just a prototype, Coke is looking at embedding Google Cardboard into their packaging:


Instructional Videos for New Features: Revision History

WECDSB | Revision History Updates ↑ WECDSB Revision History Updates Short ins...